We strongly recommend using the native Windsurf Editor or the JetBrains local plugin for their advanced agentic AI capabilities and cutting-edge features.
The VSCode plugin is under maintenance mode.
Gathering extension logs
Starting in VS Code Extension 1.10.0, the Extension Diagnostics are accessible for download via the Settings page. This download will contain a collection of relevant logs and parameters into a text file. For full output logs of VSCode:-
Go to the Command Palette (
Ctrl/Cmd + Shift + Por go to View > Command Palette) -
Type in “Show logs” and select the option that reads
Developer: Show Logs -
From the dropdown, select
Extension HostandWindsurf - You should see something similar to the image below:
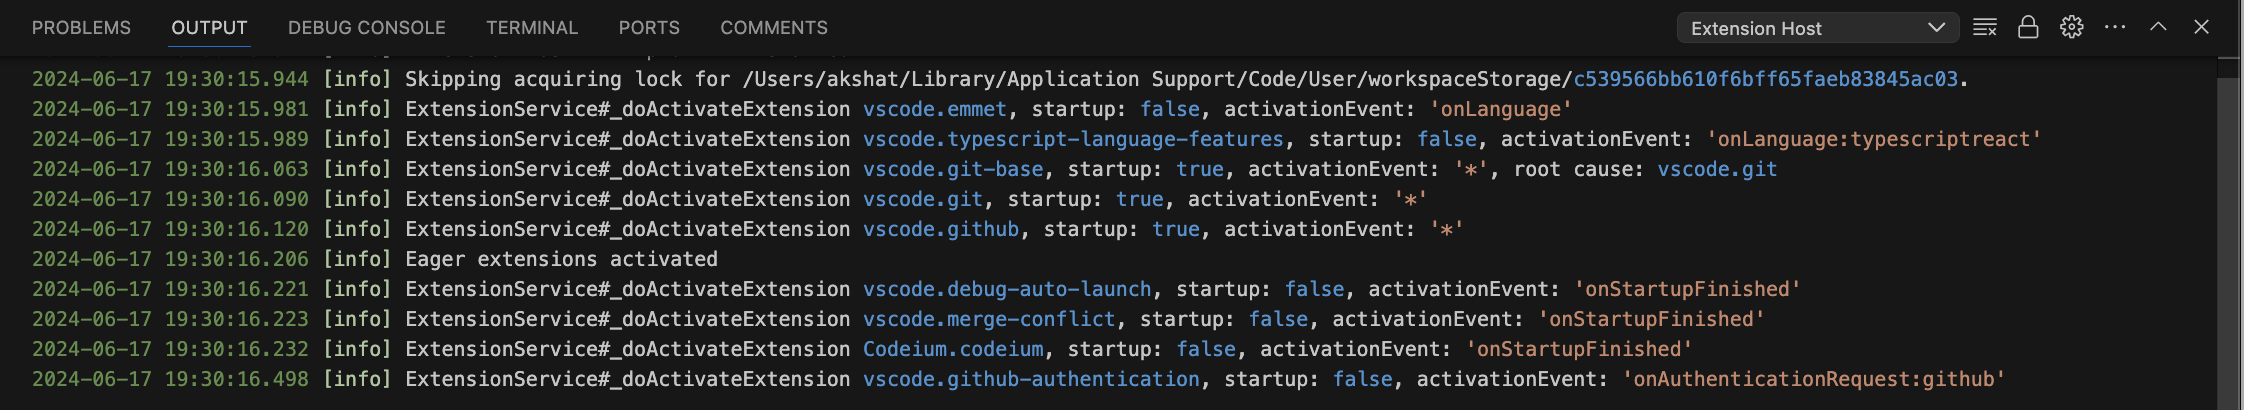
- Change the dropdown in the top right that reads “Extension Host” and select “Codeium”
- Export or copy the logs
Known IDE issues and solutions
e.split is not defined
You are using an unsupported VS Code version, please update to a supported version and try again. You can find a list of supported versions here.Using the wrong API Server
If a user changes their API Server/Portal URL in their workspace settings, this will override their user settings and may result in an error where the extension is communicating with the wrong API server. Make sure that your API Server/Portal URL is set correctly and not overridden accidentally by the workspace settings.Not seeing Codeium Chat responses
If you are trying to send messages to Codeium chat but not seeing responses, check if you can cancel the response. If you are unable to cancel the response, this means that the response was completed but not displayed. This can happen if the Chat Web Server loses connection to the extension. Reloading VS Code and opening the Codeium Chat panel again should show the responses.Unable to read file …/package.json
- Open the command palette ( CTRL + SHIFT + P )
- Run ‘Codeium Enterprise: Reset’
- Select “Help” from the popup
- Select “Show Disabled Extensions”
- Re-enable your Codeium Extension
Proxy / Network Issues
UncheckingDetect Proxy in Codeium settings in VSCode can sometimes resolve issues where the extension is incorrectly attempting to use a proxy.